Foreword:
Many who are already familiar with this method probably associate Steve Mauro with it.
Some may already have seen his videos, read documents and possibly even taken their first steps with this method.
This summary should help to read the method again in the mother tongue or, for those who have never heard of it, to bring it closer.
If you like it, be so kind and leave us a like and follow - we will share this to the best of our knowledge.
Introduction: Who are Market Makers?
The term "market maker" is often mystified or even glorified.
That should be cleaned up first.
A market maker is basically an institution, and in rare cases an individual, that provides some liquidity in the market by buying and selling an asset.
Only through this activity is trade as we know it possible at all.
For example, if there weren't a market maker, your market order wouldn't be filled immediately - which is logical, because do you think it's likely that every time you place a market order, someone else, somewhere in the world, at the exact moment with the same volume, want to enter into your opposite position? I believe the answer is no.
Now that we have clarified the job of the market maker, let's look at the reason for the activity, because it should be clear that this is not done out of charity.
First and foremost, the market maker, in cooperation with the respective stock exchange, earns on the spread.
However, due to the nature of his activity, the market maker acts himself.
Because, as we have just learned, he buys and sells assets and these should also be profitable in the interests of the market maker.
This is where the market maker method comes in, because this activity leaves "traces" on the chart and allows us to draw conclusions about his interest.
In most cases, the volume of a market maker is extremely high, which in turn requires many counter positions.
The retailer, i.e. you and me, has to "provide" these counter positions and we do that - with every trade we execute.
At this point you have to ask yourself:
If we just learned that the market maker takes our opposite position, what happens to my position when it's stopped out?
The simple answer is, the market maker took your opposite position, or in other words:
He has accumulated liquidity to fill his position and will again lead the market to his next point of interest (POI).
Some may see this as "manipulation" or "unfair," but that's just the way things are.
You can accept it or you can leave the stock market, everyone is free to decide.
We have named the other side of the coin, no trading/no markets without market makers. You are a necessity.
Now that we know the nature and the activity of the market maker, we will finally go into an example for part 1 in order to have a "face" to the term.
The crypto friends among us will still remember the incident very well, but readers who do not trade this market will also have heard about it:
We are talking about FTX or more precisely, the subsidiary "Alameda Research"
FTX ran into liquidity issues in early November 2022.
The thread was quickly drawn in the direction of Alameda, which was active as a market maker for FTX.
As events unfolded, an interview with then-CEO of Alameda, Caroline Ellison, was shared and provoked ridicule from many. ( www.youtube.com/watch?v=Qd2enI4R... )
In it, when asked how Alameda conducts its business, she replied that Alameda would operate without a stop loss.
Thousands of users were hilariously amused by this statement, partly out of gallows humor, and couldn't believe that one trades without SL, especially for such a large company.
A good joke and a laugh are always welcome, but in this case, these people have simply demonstrated that they are completely ignorant of what it is like to be a market maker, in whole or in part.
In the course of the bank run, Sam Bankman-Fried stated that the leverage was x1.7 ( twitter.com/SBF...709174572572675?s=20&t... ), which is an incredible amount for market makers.
With the volume and amount of information a market maker has, leverage isn't actually necessary.
If greed and/or loss of overview had not happened, this situation would never have arisen.
So if we put 1 and 1 together, trading without a stop loss wasn't the problem, it was the enormous risk of leverage.
-At this point, please think for yourself why you can trade at certain crypto exchanges with x100 in places.-
market structure
https://www.tradingview.com/i/OKxLkKFL/
A notice:
At the end is a sample chart from the current week (at the time of writing).
As already mentioned in Part 1, behind the Market Maker Method is the idea that market makers collect liquidity.
You can do this with the help of:
⁃ Ranges
⁃ Stophunts
Collecting takes place within these options or in a combination of both.
Here is the clarification again:
Whenever you enter or exit a position (via Take Profit or Stop Loss), you fill the market maker's position.
Without an open trade, you/your account are of no interest to him.
HOW is liquidity collected?
range :
Everyone knows what a range looks like, but what happens from the market maker's point of view?
As a rule, the price moves in a certain pip range in the Asia session.
Here you try to trap as many "breakout traders" as possible.
Common tools are aggressive wicks in both directions and repeated testing of certain price levels.
Traders enter positions hoping for a breakout and are stopped out, others want to contra-trade one of the two ends of the range and are stopped out with the wicks - at the end of the session practically nothing happened except a happy back and forth.
stop hunt :
A stophunt takes place when market makers need even more liquidity after a range or want to move the price quickly with the help of news (often seen immediately BEFORE news).
Stophunts are easily recognized by their aggressive nature.
They usually last between 30-90 minutes, go significantly above/below a range and serve the same purpose as a range.
The spread often widens during this time, so that positions outside the limits actually set are triggered.
Tip: the so-called "stop hunt box" (possible entry trigger) is 25-30 pips (for EURUSD) above/below the (Asia) range, wicks or direct reactions to this indicate a stop hunt.
Once sufficient liquidity is accumulated, market makers revert to the direction of the real trend (price turns around)
Note (for EURUSD) => Asia Session should be between 25 and 50 pips, anything above will result in less action in our main sessions (London & NY) as the price was already moving while we were inactive (in Europe).
If the Asia Range is greater than 50 = no trade on this day.
Market structure:
Now that we know how liquidity is collected, let's look at what happens to it.
The tutorial image shows a perfect Market Maker week.
As you can imagine, this is not always so clear and has different variations that we will see in later parts of this series.
Otherwise it would be too nice and too easy :-)
But to understand the structure, let's look at this perfect week:
This begins, for Europeans, with the beginning of the week and the first session (Asia) in the night from Sunday to Monday.
1. The first Asia Range is formed, this range ends with a stophunt between Asia and London in the so-called London Brink or the stophunt takes place at the beginning of London.
2. London is now heading towards the low/high of the week with sufficient liquidity available
3. Price falls back into a consolidation. London/ New York Brink starts the peak formation.
4. On Tuesdays London or NY Rise/Drop Level 1 starts and ends with a sideways phase/slight correction.
5. Rise/Drop Level 2 will take place in London and/or NY on Wednesdays.
6. Thursday Rise/Drop Level 3 will be processed in London and/or NY. Preparation of the Midweek Reversal (next peak formation)
7. Thursday to Friday the shaping of the peak formation is processed.
8. Drop/Rise Level 1 (possibly also Level 2 -> News) - back towards the price level of the first Asia session of the week.
Actually nothing happened, the price is basically the same as 5 days before.
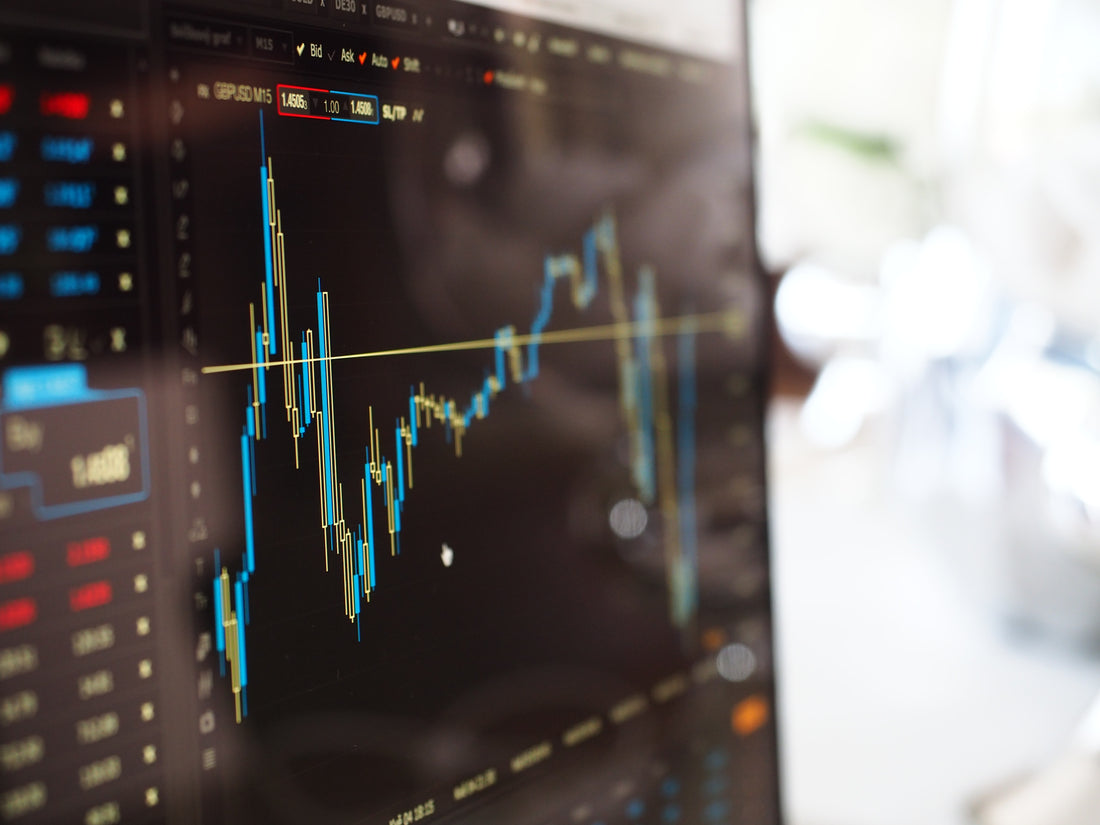
Here's an example from last week on GBPUSD, which comes pretty close to that "perfect week":

Remarks:
As you read, it becomes clear that Asia rarely drives the price. This is not to say that nothing ever happens in Asia, just that usually London and NY are responsible for push ups/downs. (keyword trading volume)
As already mentioned, there are other variants, the span of time varies between 3 and 5 days and of course the start of this structure varies.
There are also "resets" for which we have certain indications to recognize them. (later parts of the tutorial)
All this is not set in stone, there is point 1, e.g. even without a stophunt or Asia operates level 1 and London is the range etc.
Very important : If you cannot count the current cycle due to confusion or similar = no trade, a new peak formation always comes for the count restart.
This structure shows:
Market makers don't care about the price of a single asset - it's not about chasing a price from high to high / low to low.
Even the market maker does not have an infinite amount of money at his disposal, even if he wanted to, he could not.
It's more like working from range to range in order, as mentioned at the beginning, to collect new liquidity again and again and thus earn money after the levels.
(Retail) traders want to trade the trend and that is understandable.
When they catch it, however, most of them give up their winnings in the ranges.
I think after reading it you will understand why that is.
The peak formation

Why is the peak formation so important?
The peak formation usually indicates the end of a market maker cycle,
serves as the turning point of the MM trend and is the output of each count.
What happens in a peak formation?
The following example shows the Peak Formation High, the same applies, vice versa, to the PF Low

1. After (several) days of rising prices, the PF catches the late buyers.
"The price doesn't fall at all, I'm missing something"
Fomo is punished.
2. After the first peak, the "Early Shorters" come onto the market.
Basically, you are not wrong with your idea, you may have counted, but they are only briefly confirmed, while the "late buyers" are stopped out.
3. The middle part of our "Ms" has formed.
Even later buyers feel confirmed, the price has received "support" (it can always draw horizontal lines on a chart (you're sure to find one right there as well) and go long.
These positions are in the green until the early shorters are stopped, at which point our peak formation is formed.
The real trend can start and positions can be stopped out along the trend path.
What happened?
Basically nothing with the price - on smaller timeframes you might see a range or see the whole thing as a double top.
But for the market makers, this is what happened:
3x retail positions were stopped out with a simple chart pattern and as we already know from the previous parts of the tutorial:
Where we, the retailers, are stopped, market makers accumulate liquidity for their positions.
Accordingly, the actual trend can now be wonderfully set in motion.
How can a peak formation be identified?
There are several pieces of information useful in identifying a peak formation.
The following key points can, but do not have to, occur in a PF:
1st time:
...in part 2 we discussed the cycle -> 3-5 days, we are in a chart that shows an up/down trend for several days = be careful.
2. Pincandles:
...or Vicks. As just discussed, MM accumulate liquidity with this pattern. Wicks are a clear indication of this gathering, so these will often be seen when a PF is formed.
3. Time difference between the two peaks
...I originally learned that a PF forms in a relatively short time (2 hours), but today, and from the fact that I'm looking for mine in the 1 hour time frame, I would assume 3-7 hours (FOREX). In terms of time, a PF thus fits into a session.
Varies from asset to asset and market to market! You have to analyze the past
4. TDI
...an incredibly useful tool of the Market Maker Method! Likes to help form a peak formation. (more on this in part 4)
PF often occurs in the "overbought" area (overbought/oversold)
Often with divergence!
5. EMAs
...the basic tools in the Market Maker Method (more on this in Part 4).
EMAs usually flatten out in a peak formation, giving you clues as to how they came about.
Peak formation on a chart:

Remarks:
1. Never count the weekends with Bitcoin (crypto in general).
(= Thursday to Wednesday are 5 days etc.)
2nd ranks exist. Don't be discouraged. If the current chart is not suitable for counting, do not trade or only trade again when there are indications.
3. We will see the "Peak Formation" pattern again later in the tutorial - only the higher-level variant that allows us to count and is responsible for cycle turns was discussed here.
tools

1. The EMAs
The EMAs are probably our most important tool for orienting ourselves according to the Market Maker Method.
Are needed:
EMA 5 = Green
EMA 13 = Red
EMA 50 = Yellow
EMA 200 = White
EMA 800 = Purple
What do the EMAs tell us?
The EMAs help us identify peak formation (see part 3 of the series), identify consolidation levels (see part 2), count rise/drop levels (see part 2), give us entry triggers, and serve us as a target for take profit (mainly EMA200 and 800)
Let's go into the individual points mentioned above:
Peak formations:
On a PF, in most cases the EMAs will flatten out, logically, since the price also moves sideways to form the PF.
A flat EMA50 is the ideal state for a PF.
Detection of consolidation levels
The "short" EMAs (5+13) will flatten out. One waits for the next larger ones (50, possibly 200), which are then gladly used as a basis ("support") for the next rise/drop level.
Rise/drop level count
rule of thumb:
Cross EMA13 with EMA50 signals level 1.
Cross EMA50 with EMA200 signals level 2.
This is not always the case, of course, but these crossings should be kept in mind when counting.
Entry trigger
Should one think one has spotted its peak formation, the cross of the short EMAs, 5/13, is the first clue.
If you like it more conservative, wait for the Cross 13/50.
Take Profit:
Self-explanatory.
2. The Sessions
We want to be "inline" with the market makers, so it makes sense to be active when they are.
It helps us to know when the individual sessions are.
If you want to keep an eye on more sessions, you can add Sydney and Frankfurt, but these are covered by Asia+London with a one-hour delay.
This can be displayed with the help of an indicator or you can keep an eye on the clock yourself (think of summer and winter time!)
"Brinks" describes the preparation time of the respective session. This lasts 30 minutes before the start of London and NY.
Asia has no brink as this is the first session of the day.
3. Vector Zones
In the previous parts I mentioned again and again:
When you buy, the market maker sells and vice versa.
Vector zones form the "trails" of this high volume activity.
In short:
Liquidity is still available there and market makers have a point of interest to return to this point.
4. PSR
The psychologic support and resistance range.
The only thing we have to draw of these 6 tools ourselves.
It reflects the 1st Asia session of the week and results from its highs and lows.
The PSR is the only support and resistance zone that we pay attention to in the Market Maker Method.
Validity: One week.
5. TDI
Our oscillator of choice.
We look for the two extreme ends that give us clues of a peak formation.
Especially in connection with exceeding the volatility bands (in blue for me).
For our trend we use the market baseline (yellow).

6. ADR (Daily)
The average daily distance traveled by an asset.
Gives us inferences about the length of trend movements and helps us count levels.

setup
Logically, we want to enter the trade with a good RR ratio.
Looking at the structure of the market maker cycle, it's easy to assume that trading a peak formation would be best.
jain
As you can see from my ideas that I publish here, you don't always get the peak formation that you think you see.
That's the way things go, so while I'll go into that setup here, I want to be clear:
The entry into the consolidation levels are, from my point of view, "easier".
But let's start with the setup for the peak formation:

As confirmation of the PF, the following things should be noted:
- divergence(s)
-Spike candles to the low or high
Our setup is waiting for:
-Fast (white) TDI MA above the Market Base Line (yellow) -> see orange horizontal
-Price above EMA50
-EMA 13/50 Cross
-Stop under the detected PF
Entry would have been logically at the green horizontal line.
Setup for a Consolidation Level- "the little M/F":

There was a strong move higher the previous day and we have a peak formation low.
What we are looking for here is: London (or New York) session liquidation collection.
In the 15m time frame we will often see that "small M/Ws" (depending on whether we are in the rise or drop cycle) are formed.
These are formed either just above/below the Asia Range (as a stophunt) or in the middle of the range.
If we see such a movement, break through the market base line in the TDI again and are above the EMA50 15m TF, the entry is worth a try.
->Valid before level 2 and 3
A published idea from just now (03/15/23) as a current example:

It does NOT HAVE to be Asia.
The range session is dominant - Asia is just the most common session that ranged.
Two sessions in a row can also be used for this!
Exit trade:
1. As already mentioned, our EMAs are also considered profit targets.
EMA50 is also good for trailing the stop.
Knowing the approximate length of the moves through ADR + first level, this is also an indication of when a trade should end.
2. If the small M/W was recognized, but there is no movement after about 2 hours, the trade can be ended, London will probably not make the move anymore.
Then the NY Session can be searched for the same signs.
Note the so-called New York Reversal ("fake move" at the beginning of the NY session)
Thank you very much for reading this small but hopefully helpful tutorial series.
I hope I was able to get some people excited about the market maker method.
As already mentioned in the last tutorial, I am always available for further material or questions, also about my sources.
This is just the tip of the ice of knowledge.
1 comment
Wow, das wusste ich ja noch gar nicht! Toller Beitrag